Optogenetics
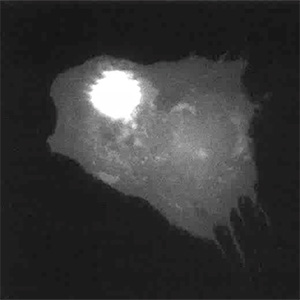
Moving laser spot induces Rac1 activation and consequent cell protrusion
by Yi Wu
Nature, 46:104-110, 2009
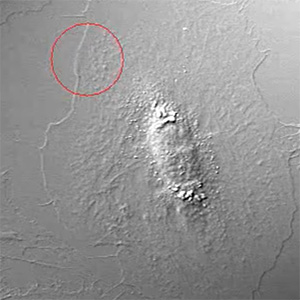
Pulses of light on one spot along the cell edge (red circle) activate Rac1 locally, producing first ruffles and then a protrusion
by Yi Wu
Nature, 461:104-110, 2009
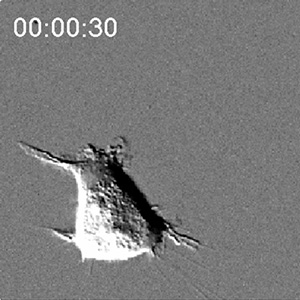
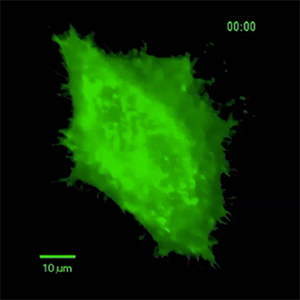
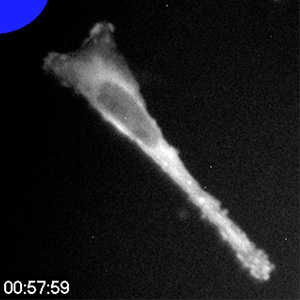
HEK293 cell follows a light spot that activates Rac1
by Yi Wu
Nature, 461:104-110, 2009
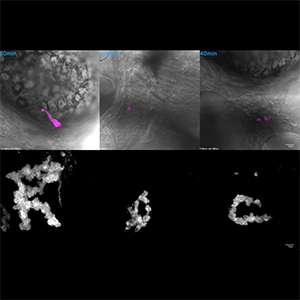
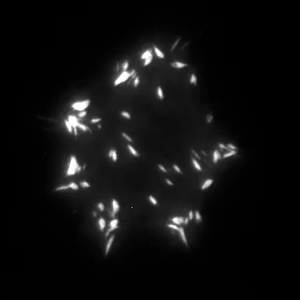
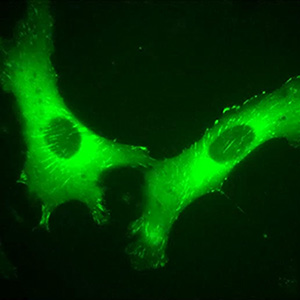
Fluorescent neutrophils in living zebrafish spelling "Rac"
by our collaborators, Sa Kan Yoo and Qing Deng, in the Huttenlocher Lab
Dev. Cell, 18:226-23, 2010
NIGMS Biomedical Beats: "Cool video: Leading Cells with light"
with captions and narration by NIH, images by Yi Wu
NIGMS Biomedical Beats, Sept, 2009
LOVETRAP reversible sequestration of GFP at mitochondria
by Hui Wang
Nature Methods, 13:755-758, 2016
LOVTRAP activation of VaV2 produces cell oscillations
by Hui Wang
Nature Methods, 13:755-758, 2016
Rac1 photo-inhibition
by Onur Dagliyan
Science, 13:755-758, 2016
Vav2 photo-inhibition
by Onur Dagliyan
Science, 13:755-758, 2016
Optogenetic control of nuclear import
Developed by our collaborators in the Kuhlman Lab
Nature Chem. Biol., 12(6): 399-401, 2016.
Biosensors (Genetically encoded, HALO, SNAP, Binder/Tag…)
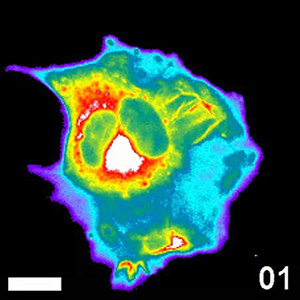
RhoA activation versus localization in a moving fibroblast
by Olivier Pertz and Louis Hodgson
Nature, 440:1069-1072, 2006
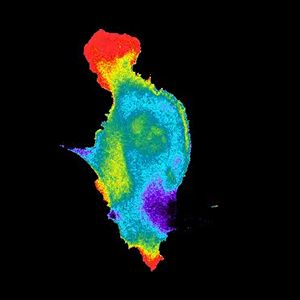
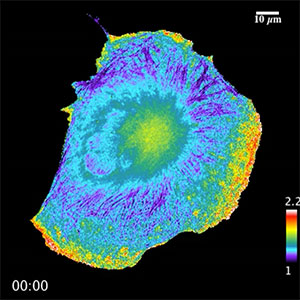
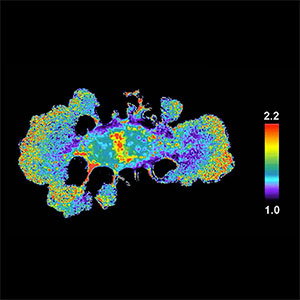
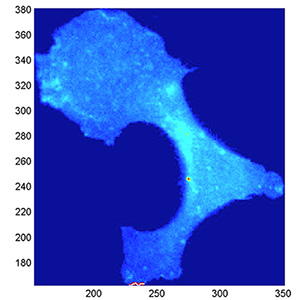
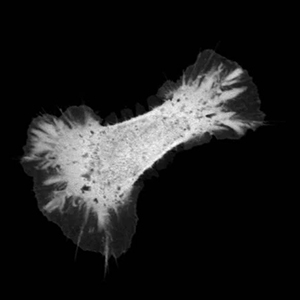
Rac1 activation in a motile fibroblast
by Christopher Welch
Nature, 461:104-110, 2009
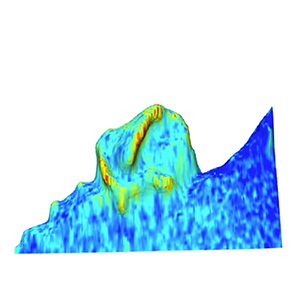
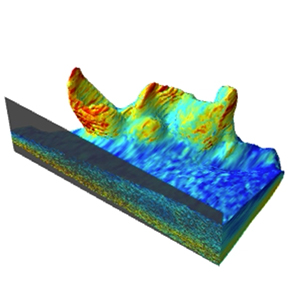
Activation of Rap1 in dorsal ruffles. 3D analysis using ImageTank
by Ellen O'Shaughnessy
J. Cell Biol., 218(9):3153-3160, 2019
GEF-H1 Microtubules (L) control GEF-H1 activity (R)
by Mihai Azoitei.
J. Cell Biol., 218 (9):3077–3097, 2019
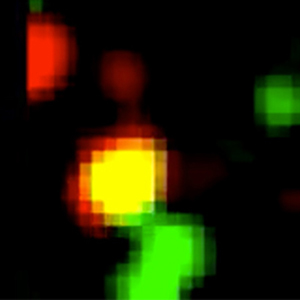
Conformational changes of individual molecules within living cells. Using binder/tag, Src molecules turn yellow when in open conformation.
by Bei Liu
Cell, 2021:Oct11; doi.org/10.1016/j.cell.2021.09.026
Simple engineering of FRET biosensor using binder/tag. Src activation during cell motility.
by Bei Liu
Cell, 2021:Oct11; doi.org/10.1016/j.cell.2021.09.026
Biosensors based on environment-sensing dyes
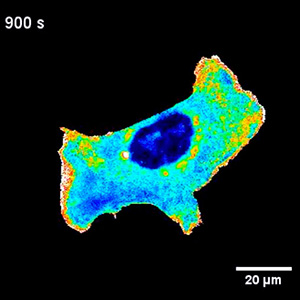
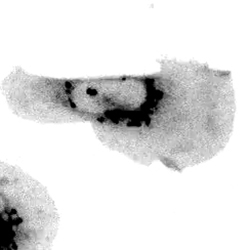
Cdc42 activation in RhoA-inhibited cell; meroCBD biosensor
by Perihan Nalbant and Louis Hodgson
Science, 305:1615-1619, 2004
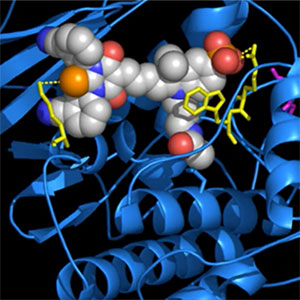
Merocyanine dye on phospho-ERK2
by Alexei Toutchkine and Brenda Temple
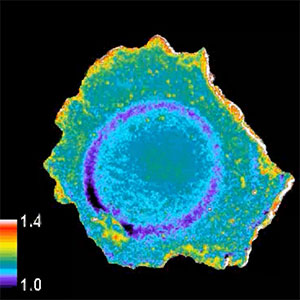
Image analysis and modeling
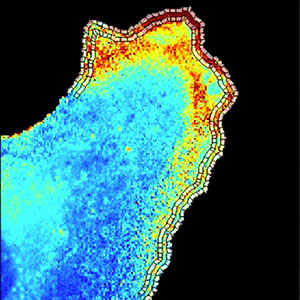
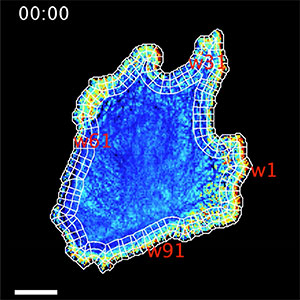
Sampling windows track the cell edge for localized assessment of biosensor activity
Developed by our collaborators in the Danuser lab.
Nature, 461:99-103, 2009
Automated tracking of cell morphology over time. Simple 2D trace captures morphodynamics over time
Developed by our collaborators in the Elston and Tsygankov labs.
PNAS, 111(34):12420–12425, 2014
CellGeo package accurately measures dimensions and morphodynamics of complex cell boundaries
Developed by our collaborators in the Elston and Tsygankov labs.
J. Cell Biol., 204(3):443-460, 2014
Analysis of coordinate GEF-H1 and cell protrusive activity. Analysis by Danuser lab
by Mihai Azoitei.
J. Cell Biol., 218(9):3077–3097, 2019
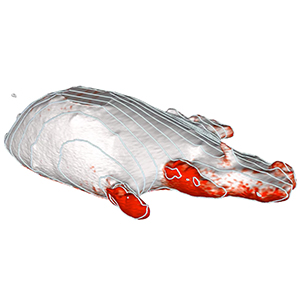
Rap1 activity bridges ventral ECM interactions and dorsel ruffles.
3D visualization using ImageTank software
by Ellen O'Shaughnessy
J. Cell Biol., 218(9):3153-3160, 2019
3D view of Rap1 activation in moving fibroblast using ImageTank
by Ellen O'Shaughnessy
J. Cell Biol., 218(9):3153-3160, 2019
Engineered allosteric control of protein activity
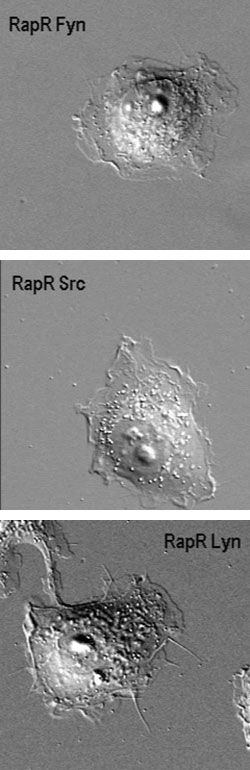
RapR analogs of Src family kinases. Specific activation of the closely related family members Fyn, Src, and Lyn produce different cell phenotypes.
These 3 videos show: top - Fyn (spreading); middle - Src (spreading followed by movement); bottom - Lyn (suprising kinked extensions).
by Pei Hsuan Chu
PNAS, 111(34):12420-25, 2014
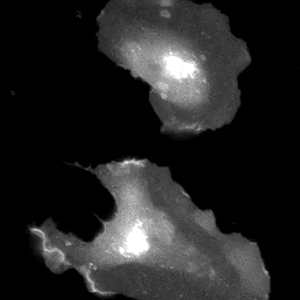
Activation of RapR-Src generates cell spreading and adhesion dynamics
by Andrei Karginov
Nature Chem Biol, 10(4):286-90, 2014
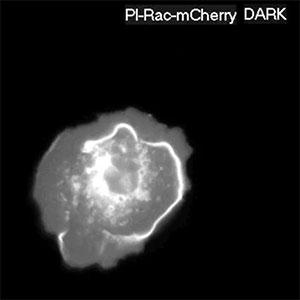
Multiplexed optogenetic control, using photo-activatable Vav2 (PA-Vav2) and photo-inhibitable Rac1 (PI-Rac1) in the same cell
by Onur Dagliyan
Science, 354(6318):1441-1444, 2016
Miscellaneous
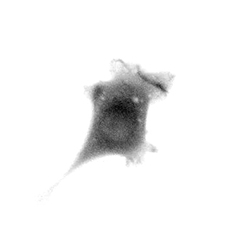
Cytotoxic lymphocyte killing a virally infected fibroblast (oldie but goodie)
by Klaus Hahn, Robin DeBiasio, Greg LaRocca, D. Lansing Taylor, and Michael Oldstone
Virology, 201(2):330-340, 1994
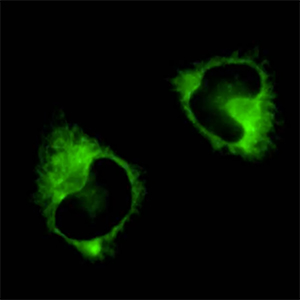
GFP Vinculin reveals adhesion dynamics and dorsal ruffles
by Louis Hodgson
Retrograde Transport
by Noah Sciaky
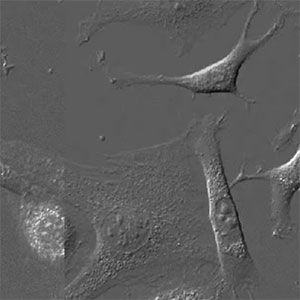
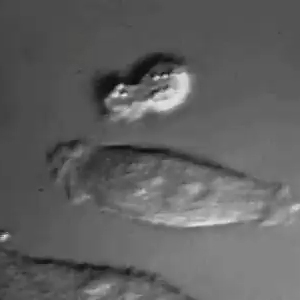
Tiled DIC movies of moving fibroblast
by Femo Shen